| |
 |
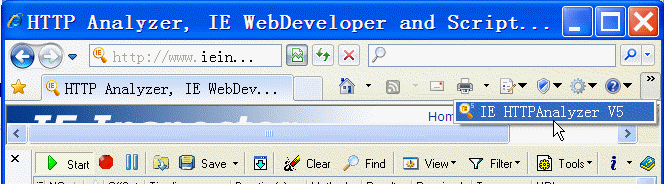
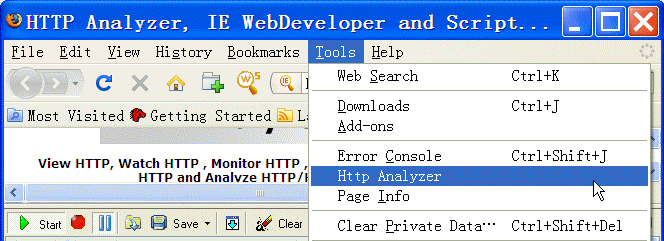
Integrate with Internet
Explorer and Firefox (available in Add-on Edition) |
|
No more switching between windows. HTTP Analyzer
Shows HTTP/HTTPS traffic and web page in the
same
window. Much easier to learn and use. |
 |
|
|
 |
|
|
Capture
wide range of HTTP Related data |
|
Unlike
many other tools, HTTP Analyzer's information
is organized into sessions for easy
identification of requests and responses.
HTTP Analyzer
can capture a wide range of HTTP related data,
including: |
-
Request and
response headers
-
Sent and
received cookies
-
URL and
redirect URL
-
HTTP verb
(GET, POST...)
-
Time start,
Time end and duration of a request
transaction
-
Content length
of page, image or file
-
Mime type of
response content
|
-
Response
content
-
HTTP status
codes or error codes if the request failed
-
Parameters
sent in a query strings
-
Post Form
values
-
Streams
-
Display whether content read from cache
|
|
Monitor System-Wide/Single/Multi Process
(Stand-Alone Edition) |
HTTP Analyzer Stand-alone includes four methods
to start logging. It can capture HTTP/HTTPS data
from system-wide/ single / multi-process. It
supports IE, Safari,
Firefox and other win32
Winsock-based http application.
- Current Session: Monitor all
applications of current user session.
- All Sessions with System processes:
Monitor applications of all sessions
including all system processes.
- New Process...: "New process..."
and "Reopen process" allow users to create
and monitor a particular process.
- Select Running processes...:
Select one or more running process and
monitor the particular processes.
|
|
|
HTTP Request Builder |
|
Users can handcraft an HTTP
request by using the HTTP
Request Builder, or they can use a
drag-and-drop operation to move an existing
request from the session grid to the Request
Builder to execute it again. User can use multipart/form-data POST
method to upload files (introduced in
RFC 1867) and View the response headers and
content. |
 |
|
|
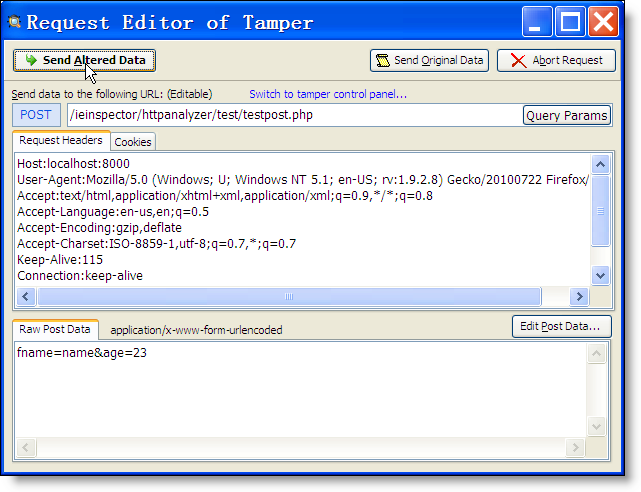
IE/Firefox Tamper
(Add-on edition only) |
|
User can tamper with HTTP requests, view and
modify GET query parameters, HTTP/HTTPS headers
and POST parameters from Internet Explorer 5+
and Firefox 3+ by using IE/Firefox tamper tool.
Since the tool exposes and allows tampering with
inconvenient input, It can help user to detect
user-input security flaws (e.g. XSS and SQL
injection vulnerabilities). |
|
WARNING: This tool makes
it simple to carry out malicious attacks against
poorly-written code. Such willful use of this
tool against third-parties is a violation of
federal, state, and local laws. |
 |
|
|
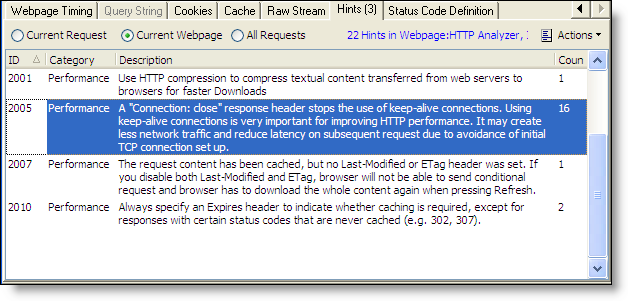
Highlights Detected Potential Problems |
|
Http Analyzer examines each request and issues
hinting messages when detecting potential
functionality ,performance or security problem.
Requests that have hintings are highlighted with
a new Hint column marker: |
 |
|
|
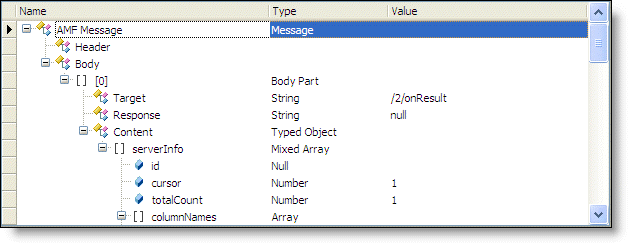
Native support for Flash Remoting |
|
HTTP Analyzer is especially useful for Adobe
Flash developers as you can view the request and
response of LoadVariables, LoadMovie and XML
loads. It also can deserialize and display all
Flash Remoting or AMF (AMF0 and AMF3) traffic in
a easy-to-use AMF object tree. |
 |
|
|
Automation
Interface |
|
The automation library allows other applications
or DLLs to talk to HTTP Analyzer Stand-alone
application or HTTP Analyzer IE Add-on, and it
can control them to capture HTTP/HTTPS traffic,
access the detailed HTTP Transaction information
and save and load HTTP Transaction log files.
A quite useful feature is that you could call
AttachProcessByID to integrate
Http Analyzer Stand-alone to your unit test and
use it to verify whether the data sent/received
by your Web method is correct. The automation
library can be used by most programming
languages (e.g. C#, Delphi & JavaScript).
The following C# code, Write all URLs to
console. |
using HTTPAnalyzerStd;//adding a reference to "HTTPAnalyzer Stand-alone Automation Library"
IHTTPAnalyzerStandAlone standalone = new HTTPAnalyzerStandAloneClass();
standalone.Visible = true
standalone.AttachProcessByID(Process.GetCurrentProcess().Id);
standalone.Start();
......
standalone.Stop();
foreach (ILogEntry entry in standalone.Log)
{
Console.WriteLine(entry.URL);
// do something
} |
|
|
Record intermediate HTTP/HTTPS
traffic |
|
HTTP Analyzer can display all intermediate
HTTP/HTTPS traffic, including redirection,
authentication and 1xx responses...
|
|
Real-time Request Level Time Chart |
|
The colored time chart is used to express the
relative time between a single network level
timing (i.e. , DNS lookup, TCP connects) and
other timing segments in the same request. |
 |
|
|
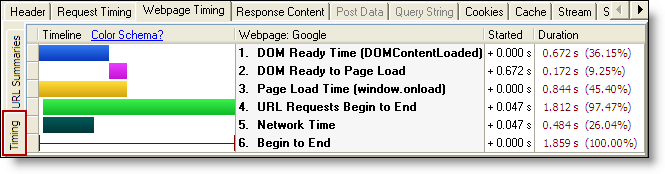
Real-time Page/Process Level Time Chart |
|
The colored bars are used to express the
relative timing of requests in the same group (
Webpage for IE Add-on, Process for Stand-alone)
and the different phases of an HTTP request or a
webpage,
e.g. blocked, connect, page load time, etc.
Please note that "PageLoadTime" is not
calculated by the child requests timing. HTTP
Analyzer gets DOMReadyTime and PageLoadTime by
listening the corresponding webpage events. The
data is more accurate and reliable. |
 |
 |
|
|
Real-time Multi-level summaries |
|
The summary panel displays the real-time updated
summary information on the HTTP/HTTPS requests
in a single webpage, a single monitored process
or the whole log. |
 |
 |
|
|
Grouping Of Requests By Page/Process |
|
In Add-on Edition, Requests are now grouped by
page by default. while in Stand-alone Edition,
Requests are grouped by process name by default.
Each group can be separately expanded or
collapsed. Requests that are grouped can be
navigated more easily. |
 |
|
|
Build-in Hex Viewer |
|
Hex viewer allow users to view and edit binary
files in hexadecimal and textual format. |
 |
 |
|
(Hex viewer,
click for larger image) |
(Hex Viewer in
stream tab ,
click for larger image) |
|
|
|
|
View text and image based content |
|
HTTP Analyzer can view
graphic images and html files
as they appear in the browser,
display HTML, CSS, JavaScript text content with
color syntax highlighting. |
 |
 |
|
(view image ,
click for larger image) |
(view
HTML ,
click for larger image) |
|
|
|
"Before
request and after response"
cache
comparisons (available in IE
Add-on Edition) |
|
HTTP Analyzer shows not
only network traffic between the browser and the
web site, but also the interaction between
Internet Explorer and the browser cache. This is an
important feature when a web site is being tuned
for performance or to determine why pages are
not updating correctly |
 |
|
|
|
Selectively clear cache and
cookie |
|
Unlike IE's clear tool, which clears all
caches and cookies indiscriminately,
while HTTP Analyzer's can
selectively clear caches and
cookies which are related
with current HTTP/HTTPS sessions. This
feature is especially important for
regression test when you wish to
initialize web application related
environment before test. It's handy to
recall bug. |
|
|
|
Decrypt HTTPS
Traffic |
HTTP Analyzer can
show you unencrypted data sent over
HTTPS / SSL connections as the same level of
detail as HTTP. HTTPS
is available if the application uses the
Microsoft WININET API , Mozilla NSS API or
OpenSSL API.
|
|
|
Support HTTP Compression |
HTTP Analyzer
supports
web application that
have HTTP compression enabled, displaying the
decompressed content
and providing information about the compression
rate.
|
|
|
MS Excel® Style data filtering |
|
HTTP Analyzer
preconfigure
many filter criteria, moreover, you
can customize filter criteria against any data item, such as
content types, verb,
response codes, URLs, headers.
(filter
builder,
click for animator gif)
|
|
|
Data grouping |
|
Automatic Data grouping-an extremely powerful data viewing and
manipulation metaphor
(group by type,
click for animator gif)
|
|
|
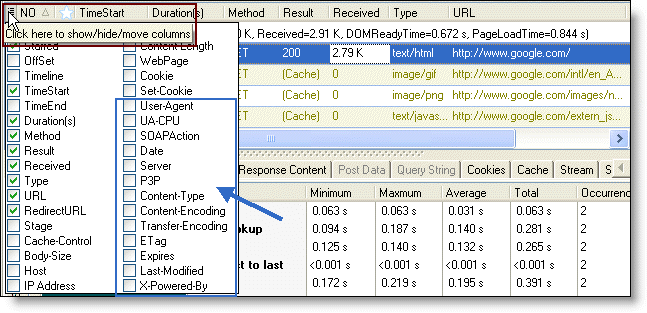
Runtime Column Selection |
|
The 36 columns can be shown in session grid. And
you can use the new quick column button to
toggle columns' visibility and reorder columns
by dragging items in the dropdown. |
 |
|
|
|
|
|
|