Follow this step-by-step tutorial to learn about the feature:
| 1. | HTTP Analyzer Stand-alone Edition: launch it as a standard windows application and open a new IE window.
|
| HTTP Analyzer IE Add-on Edition: click on the HTTP Analyzer icon in the Internet Explorer toolbar to open the HTTP Analyzer window (see launch HTTP Analyzer)
|
| 2. | By default, the "start logging" |
|
|
|
|
|
|
|
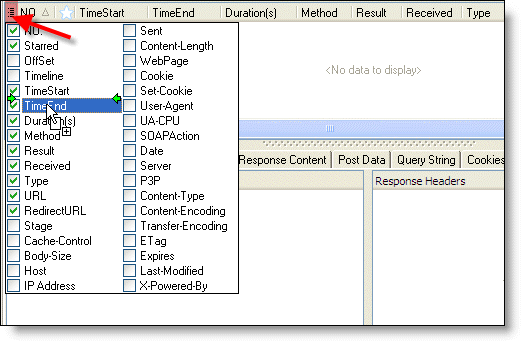
| 4. | Check on the "TimeEnd" column.
|
|
|
| 5. | Enter "http://www.google.com" in the IE address bar to navigate to it. Notice that the TimeEnd column will show the time at which the request was completed.
|